Steady income
There is a simple way to make (give or take) 10% p.a., each year. Should your portfolio be diversified further?
You are familiar with former US Fed economist ERN (or Karsten),[1] specifically his Options Series? The options component of his portfolio involves selling very specific contracts. We will define the “ERN Strategy” as put writing on the SPX equities index, very short timeframe, far below the market.
Please spend a few days digesting ERN’s incredible Option-writing Series. Make sure to read all of part 11 from March 2024.
His summary of the strategy:
- Sell short-dated, far out-of-the-money options for additional income.
- Very occasionally, you suffer a loss if options go “in the money” … But long streaks of making the full premium are usually enough to compensate for that. So far, I’ve made money with the strategy in every calendar year since 2011. In every market condition: bull markets and bear markets. March 2020, the height of the pandemic panic, was my most profitable options trading month ever.
- You make money (on average) because the option implied volatility is far higher than the average realized volatility.
- If you trade this daily, you have about 250 independent investments per calendar year. Each individual option trade may have a highly non-normal and negatively skewed return profile. But averaging over enough independent trials, you again make returns (mostly) well-behaved. They even approach a Gaussian Normal, compliments of the Central Limit Theorem;
More quotes from earlyretirementnow.com:
So, my response to the skewness concerns: I share those concerns, but if you can keep day-to-day returns mostly independent of each other by keeping your DTE as short as possible, skewness washes out over longer horizons.
(Law of Large Numbers: the 252 trading days per year provide 252 mostly independent test cases.)
The fact that I haven’t written much about options is not that they have ceased to be successful. Quite the opposite, it’s such a reliable, albeit boring, money-maker…
(He isn’t worried about yesterday’s or tomorrow’s trade because he trusts the eventual long-term outcome.)
Also,
When March 2020 came along … the options you sold the day prior were so far out of the money that even the 12% drop on 3/16/2020 didn’t get close to my put strikes.
So you can write options and the market can one day drop 12% and you are untouched (in that instance). He adds:
There were a few drawdowns, but they didn’t last very long. Each down/up cycle was much faster than your average equity bear market. … So, quite intriguingly, the early part of the 2020 bear market caused some losses, but the really volatile month of March 2020 made up for it. As I explained in my last options post, the first half of 2022 was a bit choppy. But overall, this was a very successful strategy.
And (which is true of our operation):
In fact, if you implemented this options trading strategy with a risk-free asset as the underlying asset (money market, 3m T-Bills, etc.), then your Sharpe Ratio equals the IR. Notice that a 3.0+ IR is phenomenal.
“IR” is Information Ratio and this wiki page explains it.
Writing at wealthyoption.com, another trader summarizes this put-writing strategy:
- Higher return and lower drawdown (long-term) than the S&P500
- Market agnostic - can make money in any market environment, including a bear market
- Systematic with no decision-making required
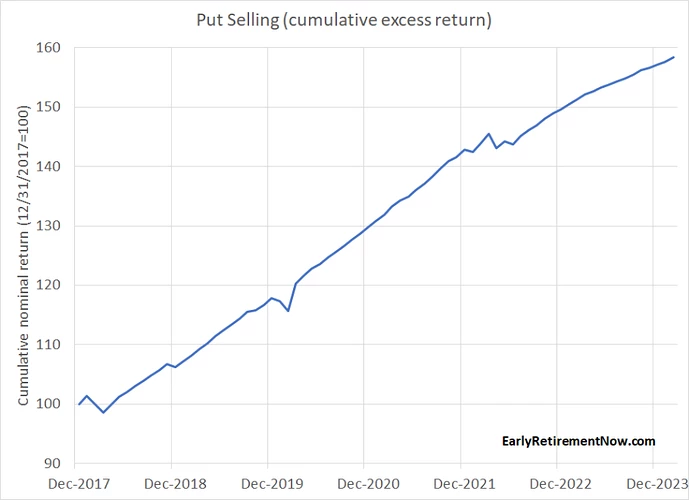
ERN provides this table of recent options-only returns (since 2018) [2]

Let’s consider a set of possible returns: 4.5% and 6.3% and 8%. This tracks the approx. 9% annual return ERN shows over 6 years in this chart: [3]
Now, adding a theoretical constant 2.5% risk-free floor, we get ultimate annual returns of 7% and 8.8% and 10.5% (pre-tax). This is with far less variance than S&P500.
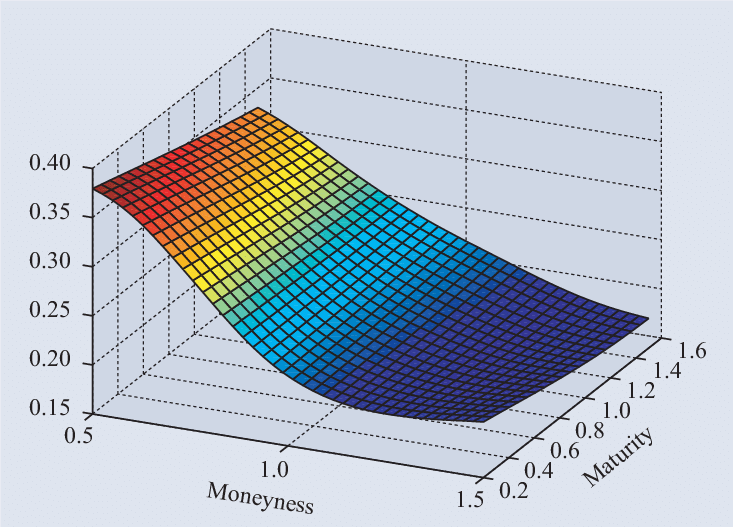
To vastly simplify Why This Always Works, we’ll use this graphic: [4]
See the top corner? Think of the intense red color as promising “High Probability of Profit.” We always profit (over time) because the options are written inside that corner. That bright spot is like shiny pennies on the ground. And everyone knows they’re there.
The option buyers constantly overpay for coverage we offer – something mentioned in this 2018 paper from Marquette Associates:
An implied volatility higher than realized volatility means that selling an option was a profitable transaction. The chart examines the average annual implied vs. realized volatility of the S&P 500 over the last 20 years. 19 of those years saw implied volatility greater than realized volatility, resulting in positive premium collection[5]
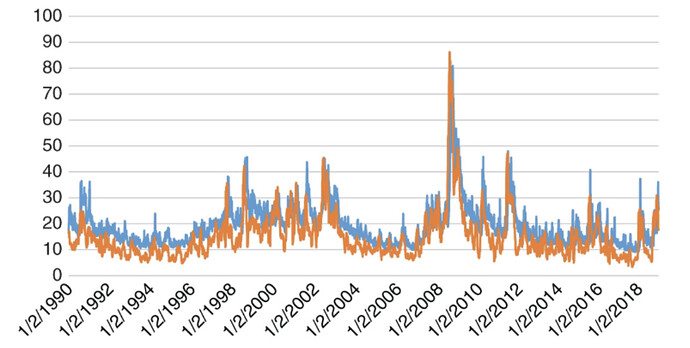
Another view of this persistently-higher-implied-volatility, since 1990:
The graph reveals that, on average, the implied volatility is 4 points higher than the realized volatility. Notably, the variance risk premium is positive 85% of the time. This means that in the vast majority of instances, the implied volatility exceeds the realized volatility. … The graph shows that the VRP has persisted for decades, and … is likely to continue into the future.
(from this VRP intro).
Now you could spend a year acquiring a rudimentary understanding of all this; or just believe ERN et al.
Proposal
Having come to believe that the ERN SPX Put-write Strategy is legit, simple, and reliable, please continue.
We propose that we can take the strategy and nudge up the leverage a wee bit without overturning the apple cart (i.e., fatally magnifying the variance). This is the key Known-Unknown: how much will variance be affected by slightly increased leverage?
Leverage is simply the number of contracts (or how much collateral is set aside per contract). See the FAQ.
Doing this Put-write Strategy, with slightly augmented leverage, we realistically would expect (including Treasuries most modestly at 2.5%) an overall returns range of 8.4 to 15.7% (pre-tax) with a mean of 12.1%.
We get 12%; what do you get?
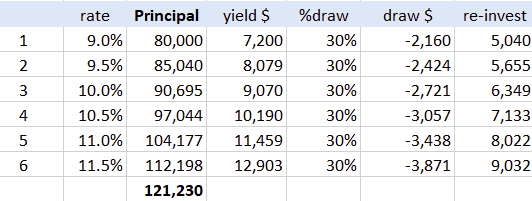
Each Member (unit holder) is promised a sequence of yields over the Unit lifetime. For example, the initial yield may be 9% and then each year the yield rate is raised 50bp. And each year the Unit’s remaining (unwithdrawn) funds are compounded.
For example, investing $80K with a 30% withdrawal yearly would produce the following (pre-tax):

Get started
ERN and thousands of traders have been doing this option play for decades. So can you. Consider joining the other Members to participate in this uncorrelated, reliable yield.
Check out the FAQ.pdf
Then contact us for more info!
( Here is the Initial QUESTIONNAIRE to fill out )
Don’t forget
=> Remember to read and fully digest https://earlyretirementnow.com/2024/03/07/trading-options-primer


